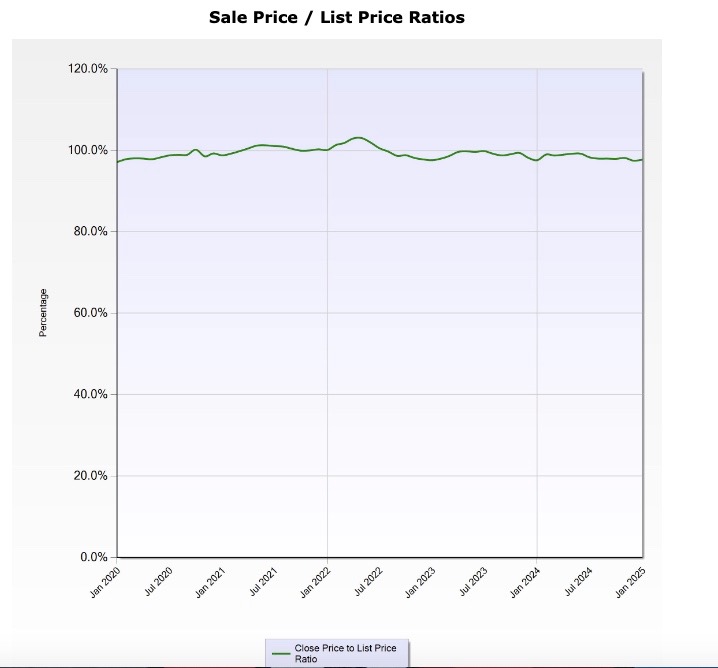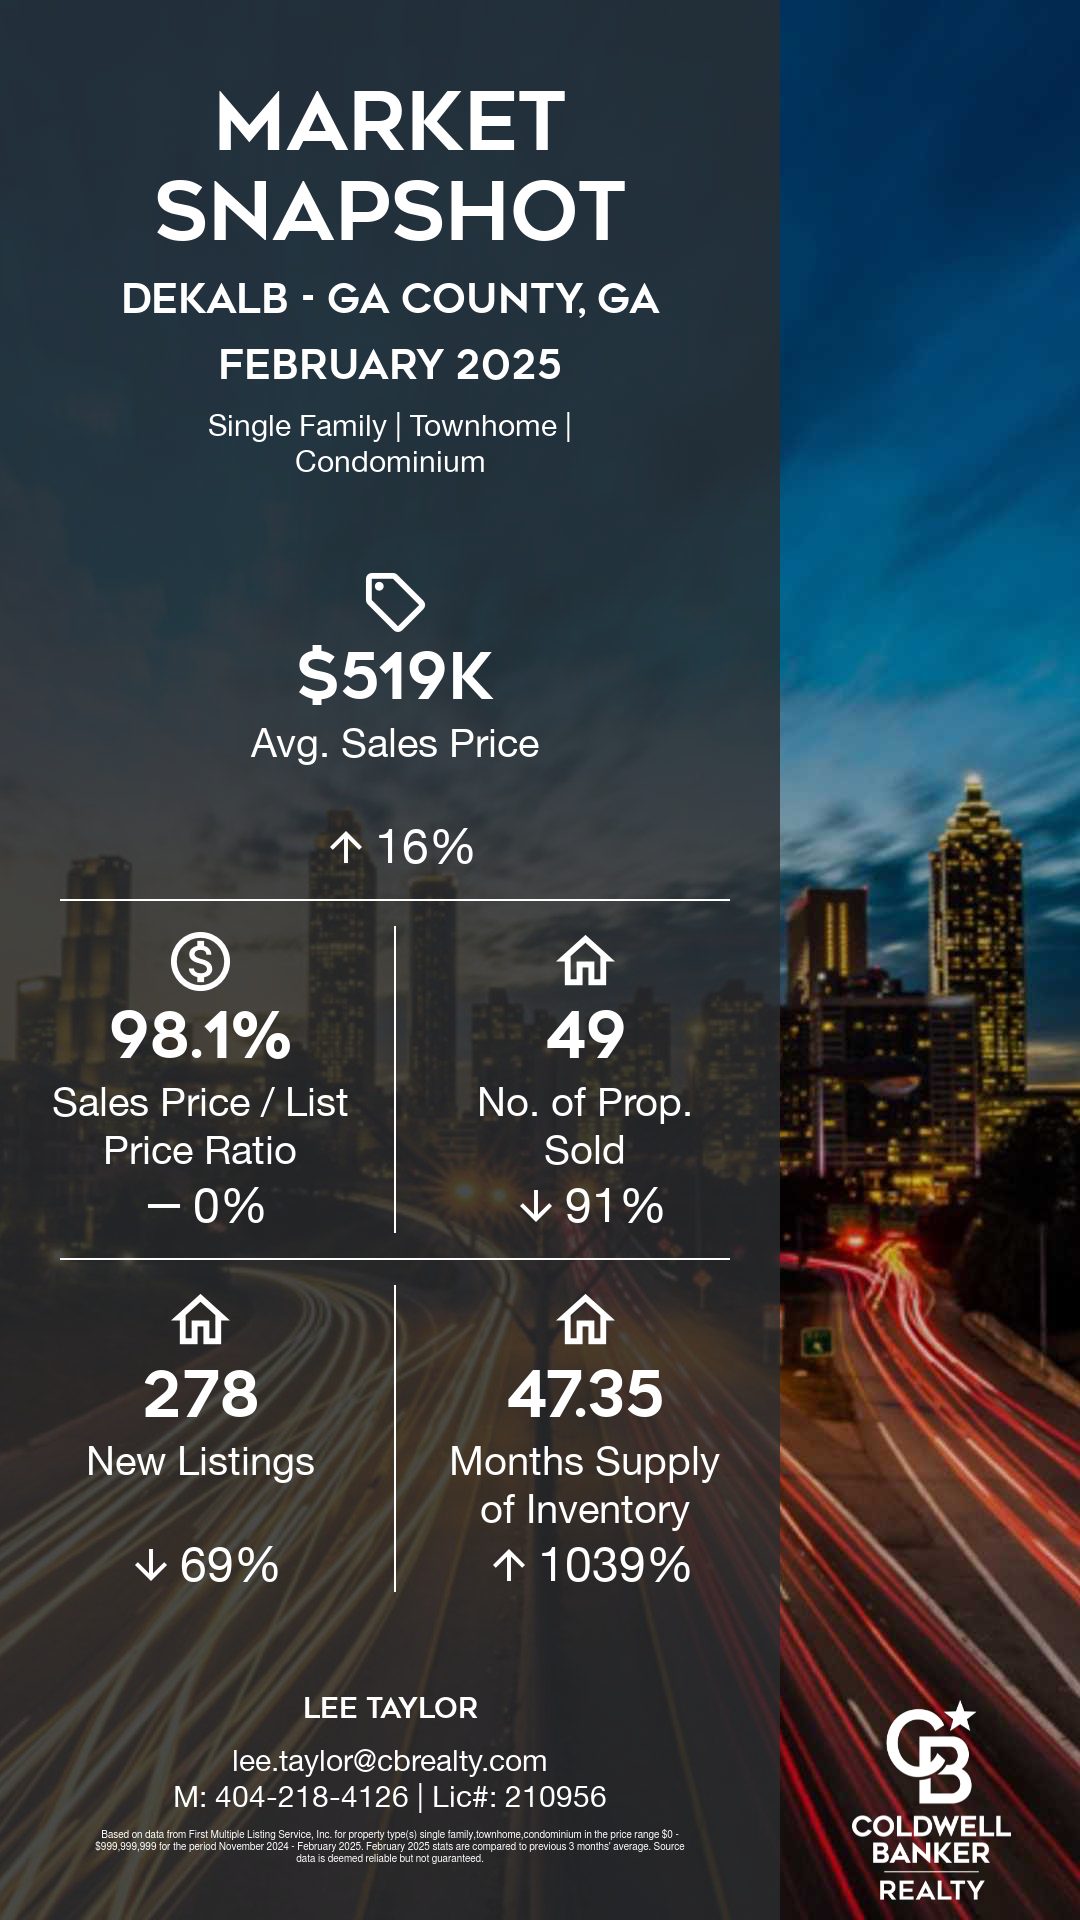
Steady as she goes for Dekalb County Georgia sellers – many if not most sellers have been getting their number, most of the time since 2020
The Market Math That Every Buyer, Seller, and Investor Needs to Know
A Note About Our Data 📊
This analysis uses verified 2023 data from:
– First Multiple Listing Service (FMLS)
– DeKalb County Tax Assessor records
– Georgia Association of REALTORS® Market Reports
– U.S. Census Bureau demographic data
2023 DeKalb County Market Baseline:
– Total homes sold: 5,280
– Average monthly absorption: 440 homes
– Median days on market: 32
– Median sale price: $425,000
– Total expired listings: 945 (some are repeats)
– Total withdrawn listings: 1511 (some are repeats)
– Average price reduction before sale: 2.5% off of list price
2021-2023 Market Trends – many more sales happened because of price softening:
– 2021 Total Sales: 4903 sales above $330,000
– 2022 Total Sales: 4967 sales above $305,000
– 2023 Total Sales: 4977 above $241,000
When 43,200 senior-owned homes potentially hit the market in a single decade, something’s got to give. Let’s break down what DeKalb County’s Silver Tsunami means for property values, neighborhood dynamics, and your real estate decisions.
The Numbers That Keep Real Estate Pros Up at Night
Recent Market Snapshot (2023) – we will have the 2024 numbers by March
– Total senior-owned properties: 43,200
– Combined market value: $12.8 billion
– Average needed updates per home: $42,000
– Current market absorption rate: 440 homes/month
– Annual amount of all sold properties: 5,280 homes
What we do know about recent Dekalb numbers is that the median sales price in January 2025 was $330,000, down -10.75% from $369,745 from the previous month and 1.07% higher than $326,500 from January 2024. The January 2025 median sales price was at a mid level compared to January 2024 and 2023. The average sales price in January 2025 was $422,038, down -7.25% from $455,020 from the previous month and equal to January 2024. The January 2025 average sale price was at a mid level compared to January 2024 and 2023.

The Domino Effect: Neighborhood by Neighborhood, school district by school district, police beat by police beat
**5-Year Prediction based on 2023 Absorption:**
– Price adjustment: 6-7% increase in average sales price over 5 years, more tepid than prior 5 years
– School district premium maintains values
– Renovation opportunity at every price point, and in every neighborhood
– Mixed-use development pressure to enable workforce housing affordability
– First-time buyer opportunity for good properties “at the perimeter”
– Investment property potential however the Silver Tsunami may lag until booming by 2031-2025
– Commercial corridor influence throughout the county
The Three Silver Tsunami Market Scenarios (Based on 2023 Absorption Rate of 440 homes/month)

1. The Gradual Shift (40% Probability)
**What It Looks Like:**
– Monthly absorption maintains 440ish homes sold per month
– Annual sales steady in the 5100-5300 range
– Natural market turnover
– Controlled renovation cycle
2. The Market Flood (35% Probability)
**What It Looks Like:**
– Monthly absorption exceeds 440 homes by 10% or more
– Inventory surge above 2023 levels
– Extended days on market
– Price pressure in specific areas of the county with weaker value fundamentals
3. The Mixed Market (25% Probability)
**What It Looks Like:**
– Variable absorption rates
– Neighborhood-specific impacts
– Price tier variations
– Micro-market conditions
Strategic Planning Windows
2025-2027
– A seller’s market for most single family detached properties. More balanced below $400,000 for the first time in a long time.
– Historical absorption 400+ homes sold per month, could be 6-10% less than in 2023
– Price adjustment downward at all price points – quality will drive top dollar sales
2027-2030
– Projected absorption rate will be similar however the fundamentals of Dekalb could change if employment weakens – for example, the Centers for Disease Control is a major employer of Dekalb County homeowners
– Price trend analysis: continuing upward, gradually – on average 1-2% per year between 2025 and 2030
– Spring markets will continue, end of year sell offs will continue
2031-2035
– The Silver Tsunami surges
– Price trend analysis: continuing upward, gradually – on average 1-2% per year continues, and could be flat or down
– When “as is” Silver Tsunami supply increases, prices will soften in many submarkets with weaker fundamentals
The Bottom Line
Lean into that 25% “mixed market” forecast. Using 2023’s baseline of 5,280 annual sales and 440 monthly absorption rate, DeKalb’s market is positioned for transformation, not collapse. The key will be managing the potential increase in inventory while maintaining steady absorption rates. Smart players will watch the data, understand the trends, and position themselves for success.
- About the Author: Lee Taylor
- Georgia Realtor since ’99
- Share this post!
#MarketPredictions #market forecast #RealEstateAnalysis #DeKalbRealEstate #SilverTsunami #InvestmentStrategy #MarketTrends #atlantarealestate

 Facebook
 X
X
 Pinterest
 Copy Link